Weather equipment at Hubbard Brook Experimental Forest, New Hampshire
written for Appalachia journal
In 1955, scientists established the Hubbard Brook Experimental Forest in the southern White Mountain National Forest in New Hampshire to study the movement of water through forests. They were interested in how to manage forests to lessen the effects of flooding, and to understand water. In the 1960s, they became interested in the “base flow” of water through forests during droughts, as a long dry period stressed the northeast. Also about that time, research expanded to encompass how nutrients flowed through the forest systems.
One stunning and unplanned outcome of more than a half-century of research there has been a strong record of the warming climate. Through measurements first devised to study droughts, floods, soil composition, acid rain, and animals, research at Hubbard Brook—which is owned and operated by the U.S. Forest Service Northern Research Station—has proven that the climate of that area has been warming at a steady rate for 54 years. All of the instruments that measure water, and all of the weather instruments that measure wind and precipitation, have kept a long record of the climate. The strongest indicators at Hubbard Brook are temperatures, stream flow levels, and snowpack depths.The seasons of the most change are winter and spring. Most of these measures are consistent with trends that climate scientists observe around the world. In 2004, scientists doing research at Hubbard Brook announced a wider approach, one that would consider many more factors beyond water and soil, like climate change and how humans rely on and affect ecosystems.
On a chilly day last November 11, when a few inches of new snow had just landed around Hubbard Brook and the many streams that feed into it in Woodstock, Scott Bailey, a research geoecologist, and Geoff Wilson, educator and undergraduate research coordinator at Hubbard Brook, showed me around several of the research sites. We drove in Bailey’s car to a point, then hiked through sloping woods from gaging station to gaging station. Hubbard Brook Experimental Forest covers 7,800 acres at elevations of between 728 and 3,330 feet. Researchers use an ideal setting of six parallel, similar streams that flow into Hubbard Brook, each stream composing its own small watershed. They also study three other streams at the southern end of the forest.
Each gaging station uses a weir, a device that looks like a triangular-shaped collector set above a small dam, with the point of the V-notch in the water. Carefully calibrated, each weir measures gallons per minute flowing through the stream. Instruments in an adjacent small gaging house measure the water level’s rise and fall. Forest Service personnel change records here every week.
Initial water research led to studies of how nutrients move through the forest ecosystem. At four of the six watersheds in the northern end of Hubbard Brook, researchers manipulated the entire watersheds and compared them with the remaining two, unmanipulated, ones. They experimented with removing vegetation underneath trees to see whether that vegetation plays a role in controlling the cycling of water and nutrients through a forest (in Watershed 2 in 1965); considered the differences between harvesting all of the trees at the same time versus cutting them in alternating strips over a period of four years (in Watersheds 1 and 4, tried in the early 1970s); and compared a whole-tree harvest with “stem-only” clear-cutting (Watershed 5
in 1983-84). A decade ago, they observed the effect of reduced availability of calcium in the soil—caused by acid rain and historical forest harvests—on the forest. Researchers calculated this calcium loss per area in one watershed and replaced it with a mineral that is similar to the natural form originally deposited by glaciers. The forest cutting experiments together demonstrated that soil lost many nutrients after the forest was cut. The magnitude of the loss was somewhat proportional to the magnitude of the disturbance (big disturbance, larger nutrient loss). Different nutrients behaved in slightly different ways, but in general, the losses were observed for less than a decade, until a new forest established itself and reasserted demand for nutrients.
By 1963, eight years after the first research began, the U.S. Forest Service and Dartmouth College had begun the joint Hubbard Brook Ecosystem Study. Today the study continues with government agencies, such at the Forest Service and the U.S. Geological Survey; nonprofits, such as the Cary Institute of Ecosystem Studies, the Hubbard Brook Research Foundation, and the Smithsonian Institution; and many other universities.
Warmer winters, later snow, lesser snowpacks, and earlier springs, affect systems below and above the ground. Over a 50-year period, from 1955 to 2005, the average number of days snow covered the ground here has decreased by 23 days. The mean annual maximum snow depth has decreased by more than 9.5 inches. To measure snowpack, scientists use a coring device. Someone has to come out on snowshoes, stick the device into the accumulated snow, measure the depth, and weigh the snow.
A decreasing snowpack means that it’s more likely the ground will freeze without snow—a condition known as soil frost. Soil frost kills the fine roots of plants and trees. Some scientists believe that the losses of nitrates in streams may be due to soil frost’s effects. An experiment started in 1997 to examine soil in adjacent plots: researchers shovel snow off one plot and compare it with a snow-covered plot. They then study microbial activity and roots in these soils.
The ice cover on the 36-acre Mirror Lake has changed over time. The lake freezes over at about the same time each winter, but “ice out”—when more than half of the ice melts for the season—now occurs earlier in April than it used to. Scientists correlate this with increasing air temperatures.
In some uncut portions of the experimental forest, scientists focus on understanding the carbon cycle. Northeastern forests in general are a sink for atmospheric carbon dioxide, an important greenhouse gas, but how long they will act as a sink is unclear, and a very interesting question. Trees and plants at Hubbard Brook have ceased to act as a sink, meaning that plant growth and decomposition occur at similar rates. Carbon can be in many places in a forest, however, and some are very hard to measure. On our visit, we observed sites dedicated to measuring belowground carbon, which is notoriously hard to measure. Milk crates catch falling leaves and sticks, and cameras placed in tubes sunk into the ground, called mini-rhizotrons, capture the timing of root growth. Researchers measure carbon dioxide in soil, which is a product of decaying organic matter. The equipment I saw was an odd mixture of very high- and fairly low-tech, but all working in concert to address the question of just what is going on below ground.
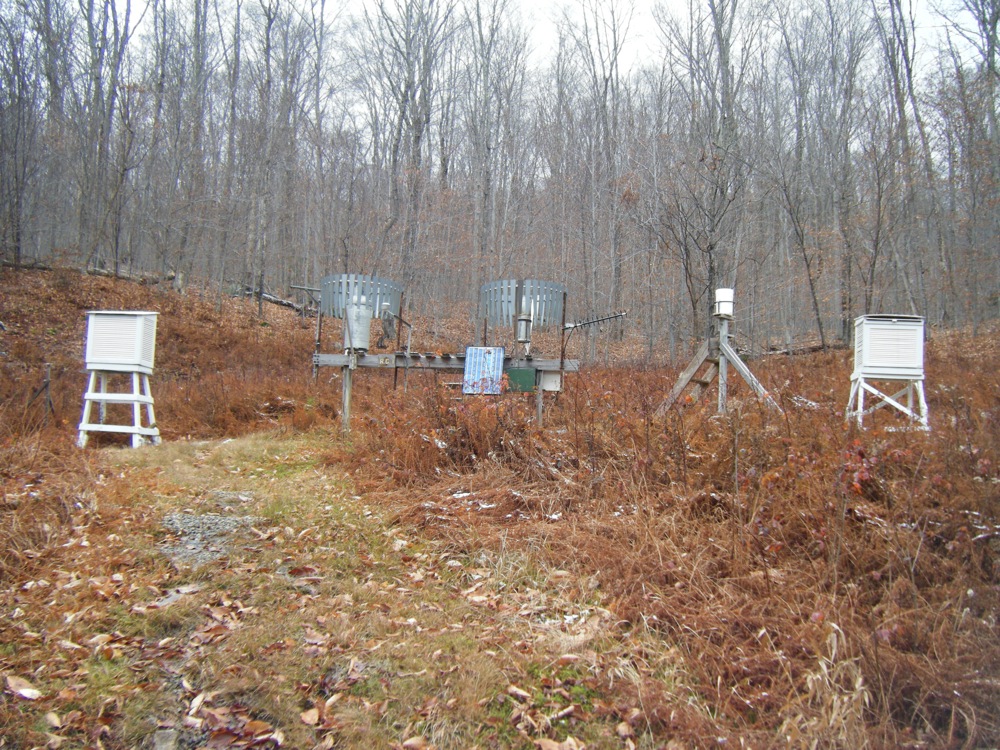
Twenty-four weather stations in this valley together produce a record of temperatures, wind, and precipitation that has proven vital to understanding climate change. Hydrothermographs measure temperature and humidity. An antenna can transmit the precipitation totals and data from the hydrothermographs to a distant lab. But researchers trudge out into the field to collect precipitation in basic chemists’ white buckets once a week. They then measure the chemical content of the rain and snow.
At Watershed 3, Bailey is studying how water moves through slopes—the length of time it takes to reach the stream. Does the chemistry of the water change during the trip through the ground to the stream? He is studying where in a slope the soil has the ability to store carbon—a question that could be very important in the future, if society wants to store carbon in this way rather than emitting it into the air. “We’re questioning the assumption that the carbon level is constant,” Bailey said. He walked over to six tubes, or wells, which are called pizometers. They are open only at the bottom, and their function is to measure the water table at that spot.
Over at the dam of Watershed 3, what appears to be a system of simple pipes and a device, a fluorometer, measures dissolved organic carbon in real time. Sitting in his office, using his cell phone, Bailey now can view data showing this and turbidity (cloudiness of the water). Real-time data allows Bailey to compare conditions in fair weather and during storms.
To the untrained eye, Hubbard Brook looks like a quiet sloping forest laced with small streams. But here in the shade of the lower-elevation forest researchers are trying to understand pollution and climate change and how society might respond to it.
The Hubbard Brook Research Foundation has published several pamphlets summarizing the policy-relevant findings of research at the HBEF and related sites. “Long-term Trends from Ecosystem Research at the Hubbard Brook Experimental Forest” describes some climate findings. For this and to read data on air temperature, ice, and more, see www.hubbardbrook.org.
About This Article
This appeared in the Research section of Appalachia journal’s Summer/Fall 2009 issue. I visited Hubbard Brook the previous autumn.
